Spot trends quickly and easily
Refine your business strategy with a better understanding of how your business changes and evolves over time.
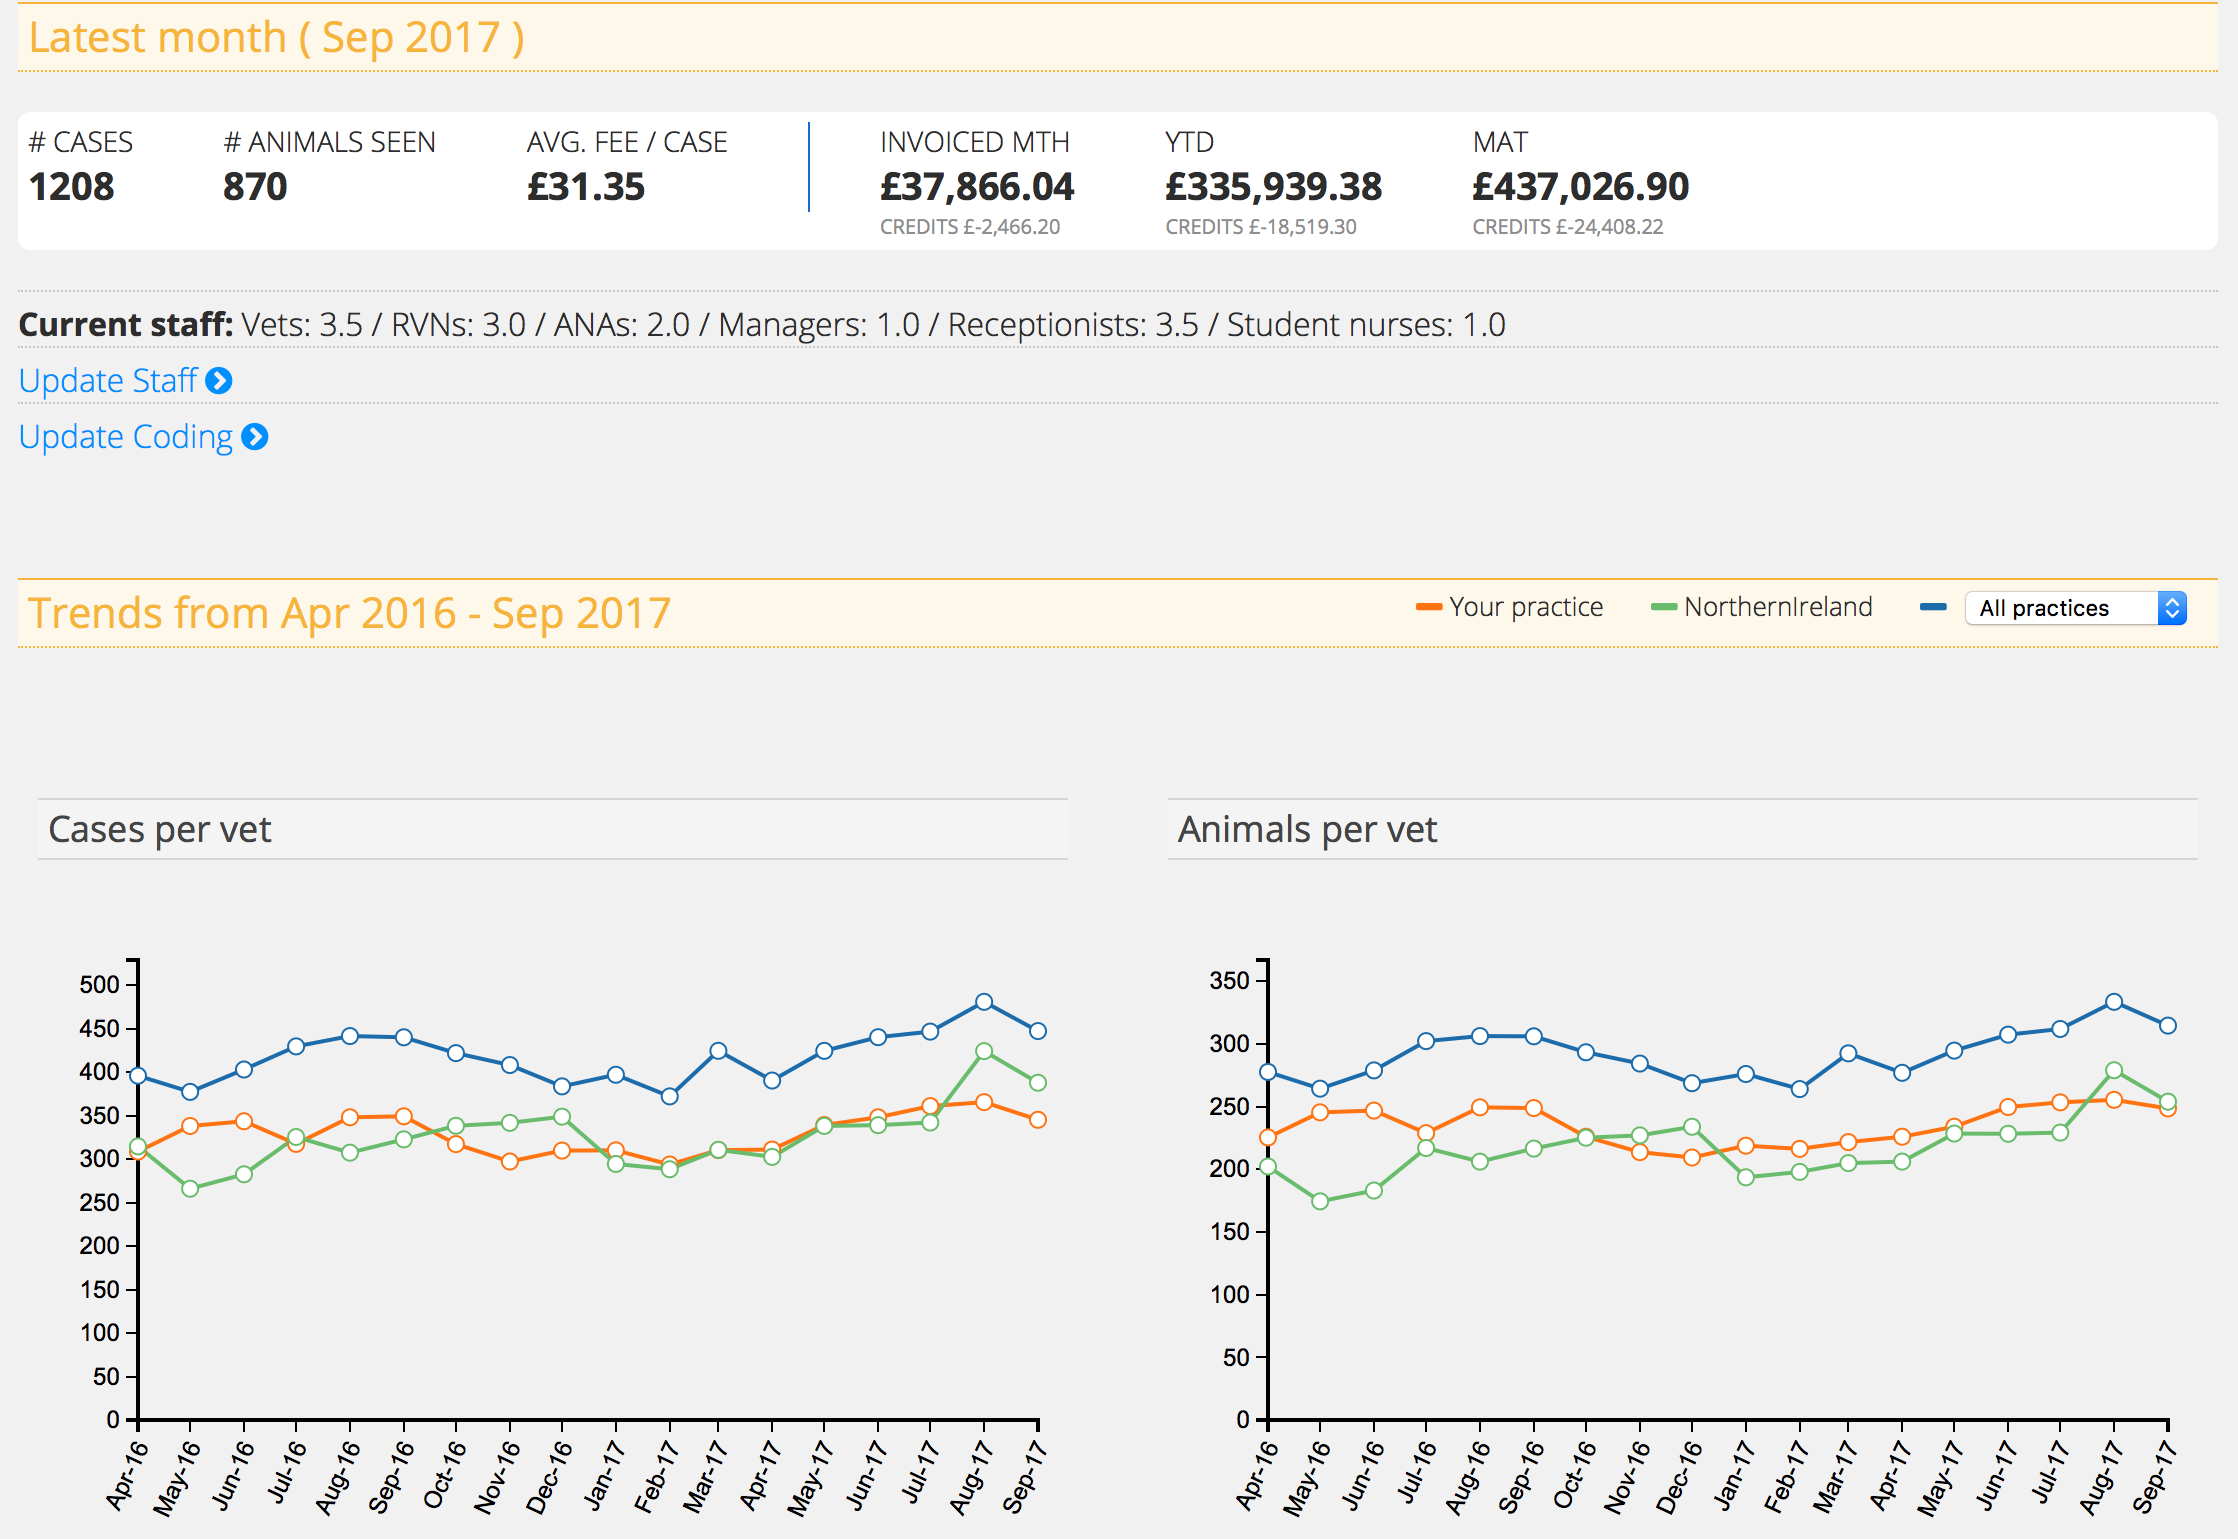
The Vet Viewer dashboard page summarises the overall statistics for your practice. It allows you to instantly access your practices key results for the previous month, before comparing them to the preceding months on subsequent graphs.

12 month trend graphs show the average number of cases and animals per vet, along with the income and average fee per vet, comparing them against the performance of others in the region.